


Launching a campaign and just waiting for leads is a straight path to wasted time and money. To catch problems with a setup early, you need a specific analytical skill: understanding how the core metrics relate to each other.
In this article, AdCombo breaks down several non-obvious signals that show a campaign is starting to lose efficiency. The material was prepared as part of the combo.learn educational project and expanded with recommendations from the AIO team.
Signal 1. High CTR, no leads
Getting a lead takes the whole sales funnel, and the funnel starts with the ad creative.
The more precisely a creative hits the target audience’s need and shows a relevant solution, the higher the chance of a click. In your analytics, that shows up as a high CTR (Click-Through Rate).
But a high CTR alone doesn’t mean the campaign is performing.
If users actively click the ad but don’t leave a request after landing, it’s time to look at the landing page.
Start by checking the problems that occur after the click:
- does the landing page deliver on the creative’s promise;
- is it clear to the user what exactly they’re being offered;
- does the page build trust;
- how fast does the page load;
- are there technical errors in the form;
- does the mobile version work correctly;
- do the page’s language and tone match the geo and audience the ads are targeting.
High CTR + no leads = a reason to analyze the next stage of the funnel.
Signal 2. High CPM, no clicks
This metric works in reverse. Once the campaign starts spending, keep an eye on CTR: the lower it is, the higher the CPM tends to be. In practice, this usually means the current creative isn’t resonating with the audience.
Facebook’s algorithm gets a weak user response, and as a result the advertiser may get fewer impressions for the same budget. Meanwhile, the rare clicks cost more, which also shows in CPC (Cost Per Click).
In this situation, the first thing to check is the ad creatives. Analyze:
- how precisely the creative matches the audience’s interests;
- is the offer clear from the first screen;
- is the main message prominent enough;
- does the creative fit the chosen geo;
- has the audience lost interest in the ad angle you’re using.
Don’t look at CPM in isolation, though. A high CPM by itself is not proof that a campaign is inefficient. It has to be read together with CTR, CPC, CR and the resulting cost per lead.
Also, conclusions about CPM and CTR only make sense on a sufficient volume of impressions: on a small sample these numbers jump around, and normal variance is easy to mistake for a problem.
When running AdCombo offers, partners get help from the in-house creative department. Designers and developers assist with ad materials and creative adaptation free of charge.
Signal 3. Leads are coming, but CPM is high
A situation where CPM grows while the campaign keeps delivering leads at an acceptable cost can happen in two cases:
- The campaign has been running for a long time, and the audience is gradually narrowing or getting warmer.
- The targeting is precise, and the algorithm has found a specific user segment with a high probability of converting.
In both cases, competition for impressions can be higher, so CPM rises. But if conversion stays solid and the final cost per lead stays within the offer’s economics, this is not a reason to stop the campaign.
Rising CPM becomes a warning sign not on its own, but together with falling lead volume and rising cost per lead. That’s exactly the combination we break down in the next section.
What matters is the whole chain, not a single metric: CPM → CTR → CPC → CR → CPL → ROI.
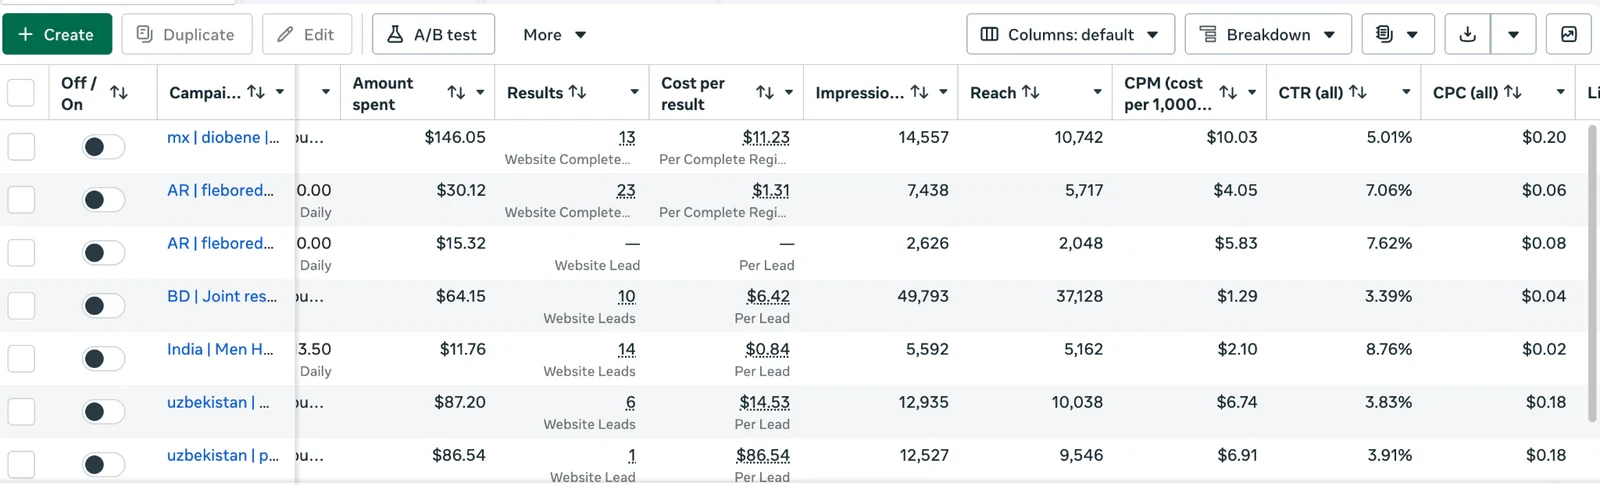
The bottom-line economics will show whether the setup still delivers the result you need.
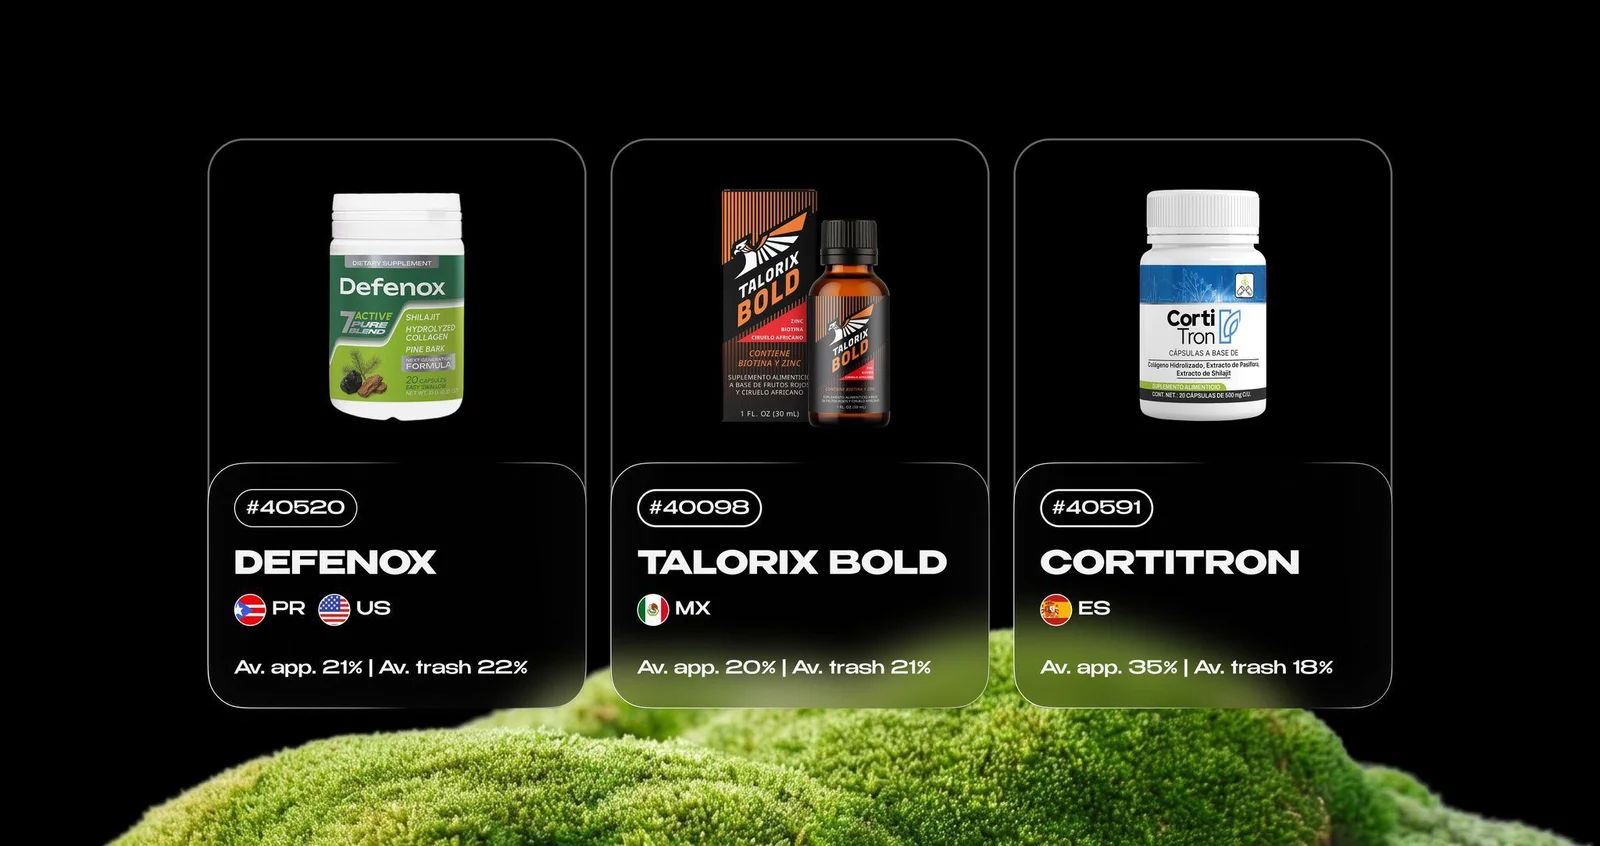
For offers paid per confirmed request, such as COD, it’s useful to compare not just cost per lead but cost per approved lead. A lead that didn’t pass approval costs more in practice than the report shows.
If you need help choosing an offer, analyzing stats, or launching your first campaigns, you can reach out to the AdCombo team. Affiliate managers help match offers to specific traffic sources and share up-to-date statistics so media buyers can objectively assess a campaign’s profit potential.
Spotting a Campaign That’s Starting to Burn Out
The three signals above help diagnose a weak setup at launch. But there’s another scenario: the setup was working, then started to fade. Here, too, one metric isn’t enough — the signals have to be read together.
Picture this: the campaign ran profitably and steadily for a long time, key metrics were fine, but over time lead volume started dropping noticeably while lead cost grew. In this situation, don’t rely on a single metric — look at several signals in combination.
First, open the ad account and check the numbers in this order: Frequency → CPM → CTR/CPC → CR → lead volume and cost.
1. Frequency keeps climbing
Facebook Ads has a Frequency metric that shows how many times, on average, the same user has seen your ad. During testing it’s usually not among the primary metrics, but once you’ve found a working setup, Frequency becomes one of the key numbers to watch.
At the start, frequency usually sits around 1.1–1.3. But once a campaign has been running for two weeks or more, the number gradually starts to grow. When Frequency approaches 2.0–3.0, the same user has already seen the creative several times. The audience starts to burn out: users react to the ad less often, clicks decline and lead volume can drop with them.
These figures are rough guides: acceptable frequency depends on audience size, vertical and offer, so the trend matters more than any specific value.
2. CPM grows along with Frequency
The next metric is CPM, but here it’s important to distinguish between a campaign in testing and an established working setup.
At launch, a high CPM can mean the creative didn’t hit the audience’s interests and needs. With a working setup, the logic is different: the audience has been found, the creative showed a good response, but over time the algorithm finds it harder to reach new users within that segment. It has to look for users in more expensive parts of the auction, so CPM starts to rise. If Frequency keeps growing at the same time and lead volume is falling, that’s a much clearer sign the setup is burning out.
3. CTR stays high and clicks are cheap, but leads are drying up
This is one of the signals people misread most often. CTR stays high, clicks come at a good price, and it may look like the ads are fine. Yet leads are declining or have disappeared entirely.
In practice, this can mean the quality of incoming traffic has changed. The core audience segment that responded best to the ad and converted into leads is nearly exhausted. To keep delivering impressions at an acceptable cost per click, Facebook starts expanding reach to users who look like the original audience but aren’t necessarily as interested in the product or motivated to buy.
As a result, the top-level metrics can still look good: CTR stays high, CPC stays low, but traffic quality declines, and conversion to lead falls with it.
The difference from the first signal is that here the creative and the landing page are unchanged, and the setup used to convert well. If nothing changed but the result got worse, the first assumption should be a shift in audience quality, not a broken page.
How to React to the First Signs of Burnout
No setup stays unchanged forever. Even a successful campaign needs regular analysis and adaptation.
At the first signs of declining efficiency:
- Compare current numbers with the campaign’s historical data.
- Check the dynamics of Frequency and CPM.
- Analyze the changes in CTR, CPC and CR.
- Compare the current CPL with your target.
- Check the quality of incoming leads.
- Check the approval rate and trash share on the offer: a drop in leads may come from the offer, not the ads.
- Test new ad creatives.
- If needed, refresh the landing page and other funnel elements.
Then act step by step: launch the updated creatives in a separate ad set without killing the old one right away, so you can compare results. Check other audience segments if needed. Only then decide whether to stop the old setup.
The main rule: never make a decision based on a single metric. The problem is that the data lives in different places: spend and frequency in the ad account, leads and approvals in the affiliate network, revenue in the offer reports. While they’re being merged manually, the dip gets noticed late, and the cause takes even longer to find. AIO helps with this kind of comprehensive analytics. It’s a platform with a tracker at its core, built for media buying teams, where data across the whole funnel lives in one system.
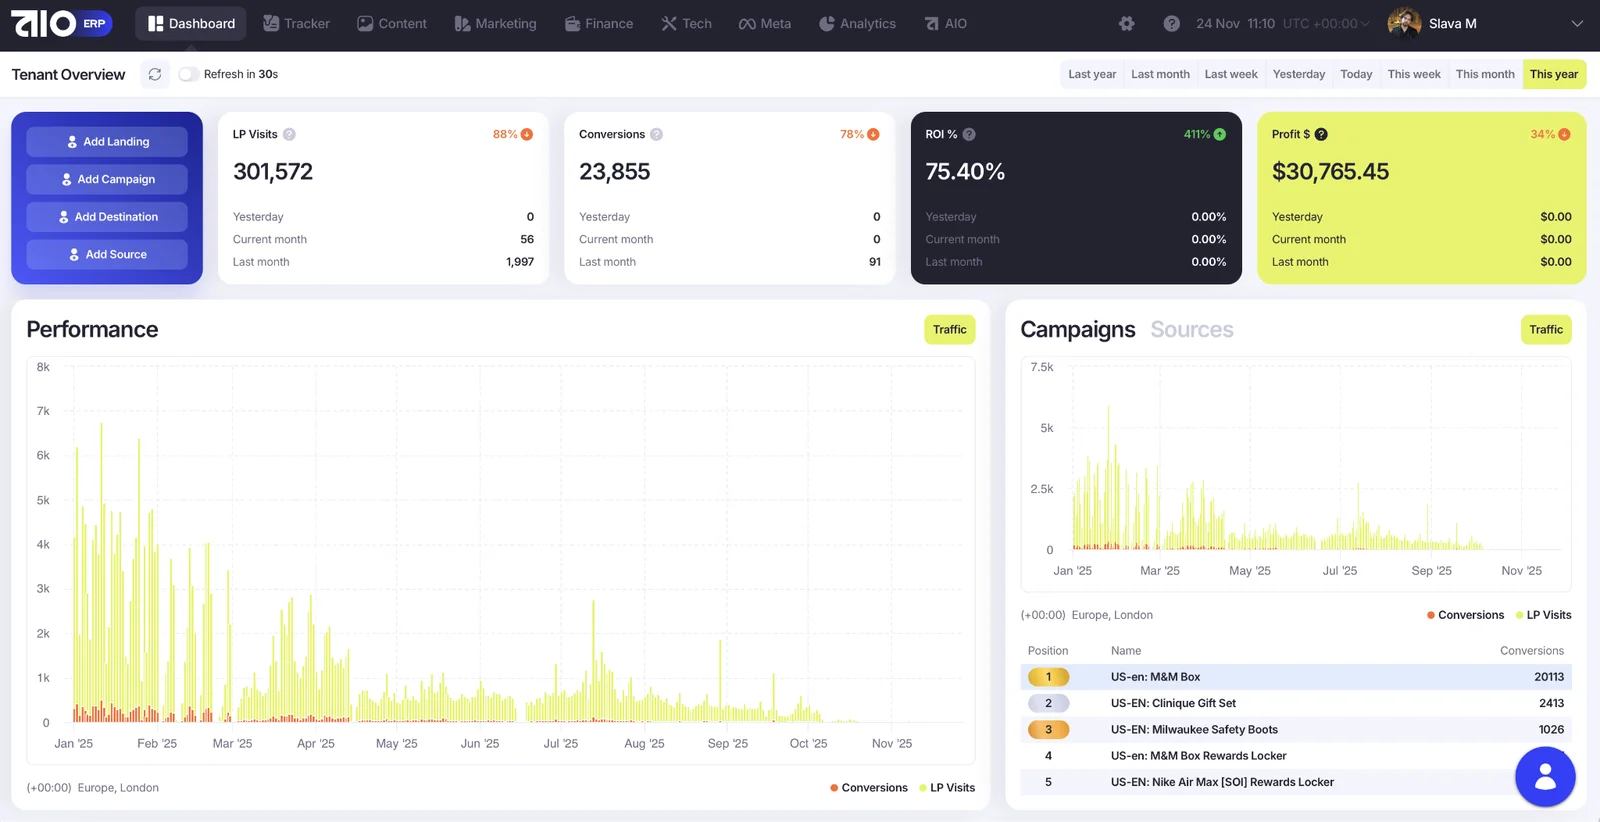
The main AIO dashboard
Ad accounts connect through the official Meta integration. AIO shows ad sets and ads, their status, balance and spend in a single currency, and an ad set that’s draining budget can be stopped without entering the ad account.
Funnel events are collected in the platform itself and attributed to the source and campaign, so costs and results are calculated together, not in two separate spreadsheets. This data feeds the dashboards in BI Builder: there are ready-made templates, including for nutra, and they can be mapped to your own metrics. If the standard set isn’t enough, you can add your own, such as cost per approved lead or approval rate.
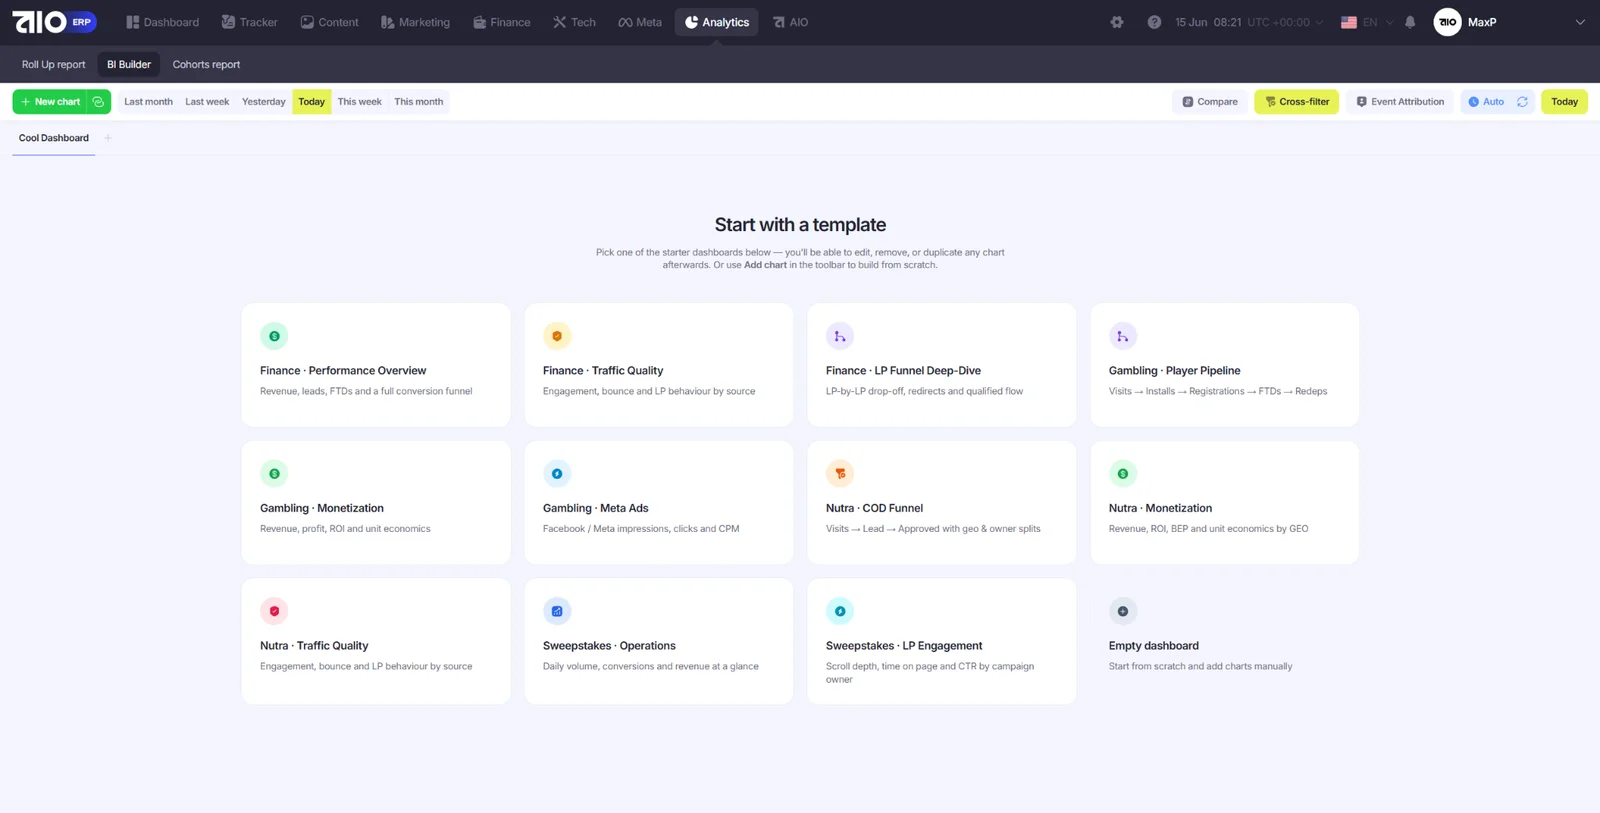
BI Builder templates in AIO
In AIO, the cause of a dip is visible on one screen. Period comparison shows the day the setup started fading and how much CPL, CR and ROI have changed. From there, breakdown tables let you drill down to the ad set, source, geo or offer, and filtering by any of them rebuilds the other blocks, making it immediately clear which segment is dragging the result down. The funnel view shows where traffic is being lost: before registration, after it or at approval. Event attribution ties late revenue back to the traffic that brought it, so traffic quality is visible across the whole journey, not just day one. And if a metric you need is missing, you can build it yourself and put it on the same screen.
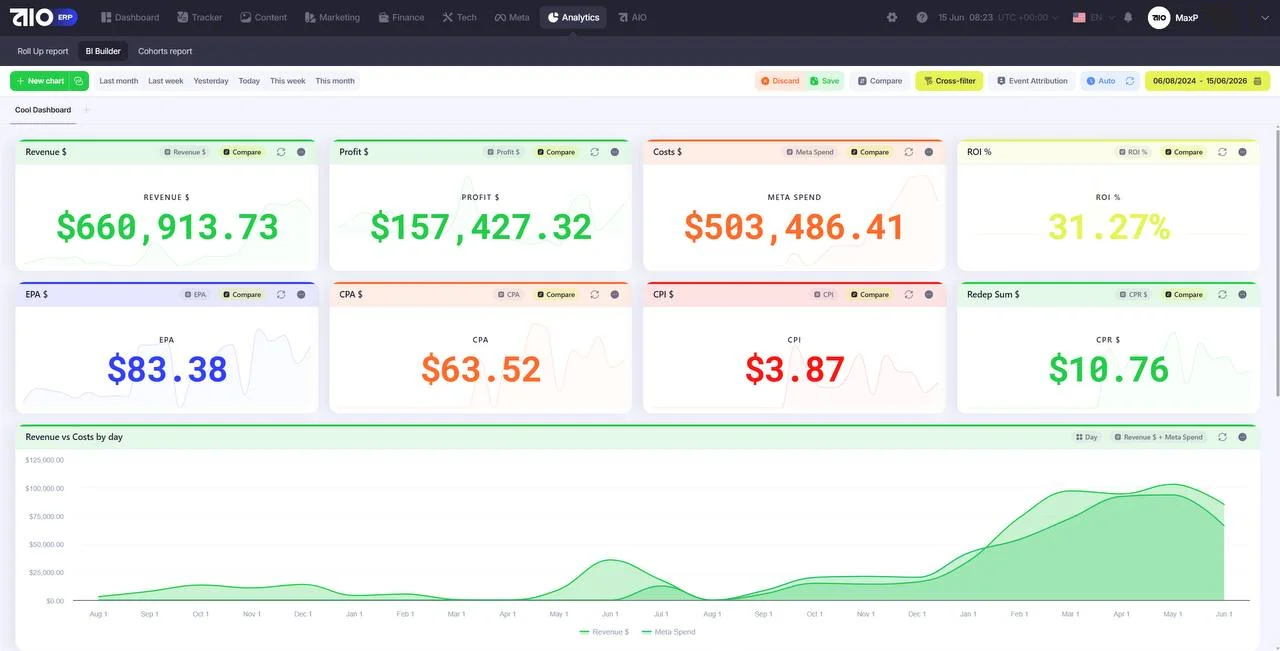
A buyer’s working dashboard in BI Builder
Conclusion
A campaign rarely burns out overnight. More often, efficiency declines gradually, and the first signals show up in analytics long before a serious drop in results. The key is to read metrics against each other, watch their dynamics and factor in lead quality, approval rate and the offer’s bottom-line economics.
This is where AdCombo and AIO complement each other. The AdCombo team helps with choosing a solid offer and working together on lead quality, while AIO brings the campaign data into one system and shows at which stage the dip begins. Together, that means not just recording a drop in numbers, but finding its cause faster.
The shorter the path from signal to action, the longer a working setup stays profitable.